
simplified and condensed distributions
![]()
![]()
![]()
![]()


IMPORTANT: distl is currently still under development, is not yet well-tested, and is subject to significant API changes. Please check back until an official release is ready.
distl provides a python object-interface on top of several distribution (random variable) functions in scipy.stats and allows for:
- serialization of distributions (so they can be saved to disk or pickled and sent to processors within MPI)
- support for units and wrapping
- conversion between different types of distributions
- math between distributions, handling covariances from multivariate distributions wherever possible
- plotting convenience functions
Getting Started
Dependencies
distl requires the following dependencies:
- python 2.7+ or 3.6+
- scipy 1.0+
- numpy 1.10+
and the following optional dependencies:
- matplotlib 2.2+ (required for plotting distributions)
- corner (required for plotting multivariate distributions and distribution collections)
- astropy 1.0+ (required for units support)
- dill (required for saving/loading Function distributions)
You can see the Travis testing matrix for details on what exact versions have been tested and ensured to work. If you run into any issues with dependencies, please submit an issue.
Installation
To install the latest release via pip:
pip install distl
To install from source locally for a single user:
python setup.py build
python setup.py install --user
Or to install globally:
python setup.py build
sudo python setup.py install
Import
Now from within python we can import the distl package:
import distl
and then create, sample from, and plot our first distribution:
g = distl.gaussian(10, 1)
print(g.sample())
print(g.sample(10))
g.plot(show=True)
Supported Distribution Types
Creation functions for the following distribution types are currently implemented and available at the top-level of distl:
- delta
- gaussian
- normal (shortcut to gaussian)
- uniform
- boxcar (shortcut to uniform)
- histogram_from_data or histogram_from_bins
- samples
- mvgaussian
- mvhistogram_from_data
- mvsamples
- function
Converting Between Distribution Types
Distributions within distl allow for converting to other distribution types.
See the API documention for the appropriate distribution type
and look for the to_ methods to convert along with a description of the options
and limitations. Below is a summary of all implemented translation methods:
- Delta
- Gaussian
- Uniform
- Composite
- to_gaussian (via histogram)
- to_histogram
- to_uniform (via histogram)
- to_samples
- Histogram
- to_delta
- to_gaussian
- to_uniform (via to_gaussian)
- to_samples
- Samples
- to_delta
- to_gaussian
- to_histogram
- to_uniform (via to_gaussian)
- Function
- to_gaussian (via histogram)
- to_histogram
- to_uniform (via histogram)
- to_samples
- MVGaussian
- slice (to convert to MVGaussianSlice)
- take_dimensions (returns another MVGaussian)
- to_univariate (shortcut to to_gaussian)
- to_mvhistogram
- to_gaussian
- to_histogram (via to_gaussian)
- MVGaussianSlice
- to_univariate (shortcut to to_gaussian)
- to_delta
- to_gaussian
- to_histogram (via to_gaussian)
- MVHistogram
- slice (to convert to MVHistogramSlice)
- take_dimensions (returns another MVHistogram)
- to_univariate (shortcut to to_histogram)
- to_mvgaussian
- to_gaussian (via to_histogram)
- to_histogram
- MVHistogramSlice
- to_univariate (shortcut to to_histogram)
- to_delta
- to_gaussian (via to_histogram)
- to_histogram
- MVSamples
- slice (to convert to MVSamplesSlice)
- take_dimensions (returns another MVSamples)
- to_univariate (shortcut to to_samples)
- to_mvgaussian
- to_gaussian (via to_histogram)
- to_histogram
- to_samples
Sampling
To sample from any distribution, call the sample method, optionally passing the number of desired samples.
g = distl.gaussian(10, 2)
g.sample(10)
array([ 8.07893271, 12.51150027,  7.56756268,  7.29151051,  5.55049747,
        8.67495845, 11.61104165, 10.11544651, 11.96864228, 10.54677169])
See these sampling examples for more details.
To ensure consistent results (when needed), pass seed to sample
or set the random seed in numpy prior to sampling.
g = distl.gaussian(10, 2)
g.sample(seed=1234)
g.sample(seed=1234)
np.random.seed(1234)
g.sample()
See this seeding example for more details.
Plotting
NOTE: matplotlib is required for plotting support.
To plot the distribution, call one of the following:
gh = distl.gaussian(5, 3).to_histogram()
out = gh.plot(200, show=True, plot_gaussian=True)
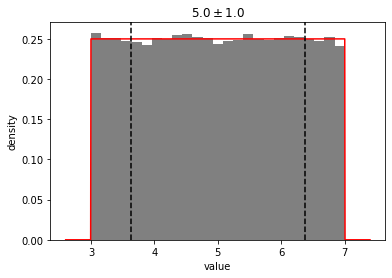
See these plotting examples for more details.
Serializing
g = distl.gaussian(5, 3)
g = distl.from_dict(g.to_dict())
See the API docs on the following for more details:
Math with Distribution Objects
Any (supported) math operator between two Distribution objects, or between a Distribution object and a float or integer, will return another Distribution object. In most cases, this will return a Composite Distribution. In some cases where it is possible to return the same type of Distribution, that will be done instead. For example, a Gaussian Distribution multiplied by a float can return another Gaussian Distribution where that float is interpreted as a Delta Distribution with that value.
This means that in the following case 2 * g is equivalent to d * g, but not g + g:
g = distl.gaussian(10, 2)
d = distl.delta(2)
Currently supported operators include:
- multiplication, division, addition, subtraction
- np.sin, np.cos, np.tan (but not math.sin, etc)
See these math examples for more details.
Note that, by default, the original distribution object and the new CompositeDistribution will be linked and therefore sampled simultaneously. See copy vs deepcopy for more details.
Support for Units
NOTE: astropy is required for units support.
Units can be set for a distribution by setting the unit, by passing unit to the constructor, or by multiplying the distribution object by an astropy.unit object.
To change units, you can then call to to return a new distribution in the requested units.
See these units examples for more details.
Wrapping
g = distl.gaussian(10, 2, wrap_at=12)
out = g.plot(show=True)
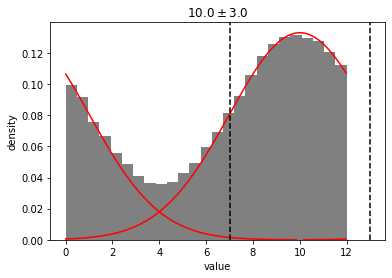
See these wrapping examples for more details.
Slicing Multivariate Distributions
mvg = distl.mvgaussian([5,10, 12],
                       np.array([[ 2,  1, -1],
                                 [ 1,  2,  1],
                                 [-1,  1,  2]]),
                       allow_singular=True,
                       labels=['mvg_a', 'mvg_b', 'mvg_c'])
mvg_a = mvg.slice('a')
mvg_a.sample()
mvg_a.plot(show=True)
See these slicing examples for more details.
Drawing and Computing Probabilities for Multiple Distributions via DistributionCollections
g = distl.gaussian(10, 2, label='gaussian')
u = distl.uniform(0, 5, label='uniform')
dc = distl.DistributionCollection(g, u)
dc.plot(show=True)
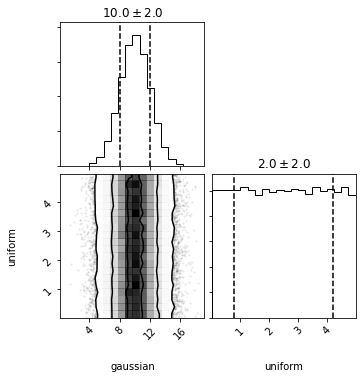
See these collections examples for more details.
API Documentation
See the API documentation for full details on each type of available distribution.
Contributors
Contributions are welcome! Feel free to file an issue or fork and create a pull-request.