import distl
import numpy as np
And/Or logic
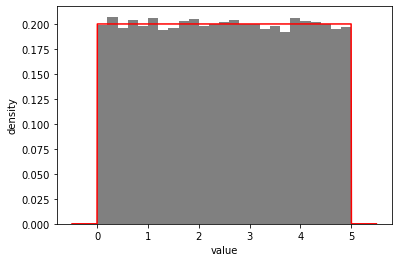
u1 = distl.uniform(0, 5)
print(u1)
<distl.uniform low=0.0 high=5.0>
out = u1.plot(show=True)
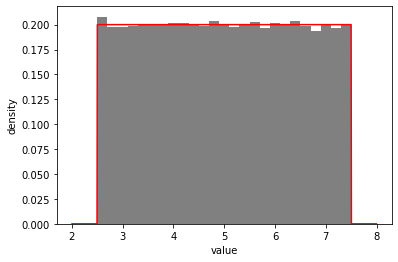
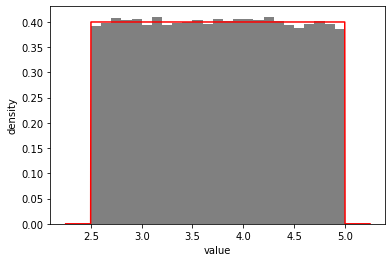
u2 = distl.uniform(2.5, 7.5)
print(u2)
<distl.uniform low=2.5 high=7.5>
out = u2.plot(show=True)
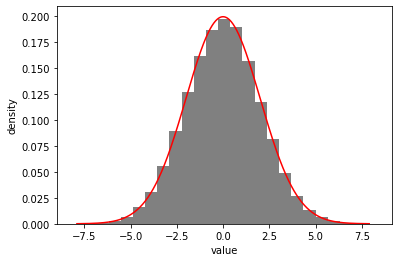
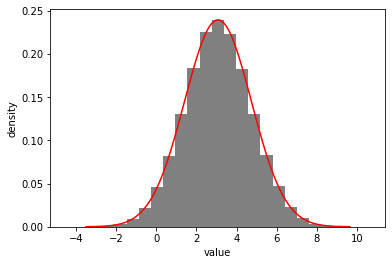
g1 = distl.gaussian(0, 2)
out = g1.plot(show=True)
g2 = distl.gaussian(10,3)
out = g2.plot(show=True)
Note that trying to apply an 'and' operator where either of the distributions is a multivariate slice will fail with an error as covariances cannot be guaranteed to be preserved. Instead you'll have to convert to a univariate manually first with MultivariateSlice.to_univariate.
OR
u1_or_u2 = u1 | u2
print(u1_or_u2)
<distl.uniform low=0.0 high=5.0> | <distl.uniform low=2.5 high=7.5>
u1_or_u2.pdf(0.5)
0.09999400035997841
u1_or_u2.cdf(0.5)
0.049999999999999996
u1_or_u2.cdf(29)
1.0
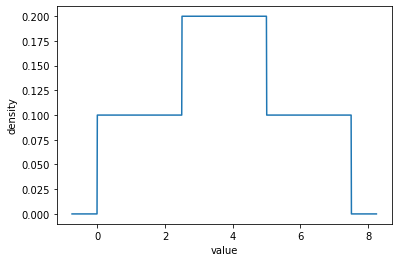
out = u1_or_u2.plot_pdf(show=True)
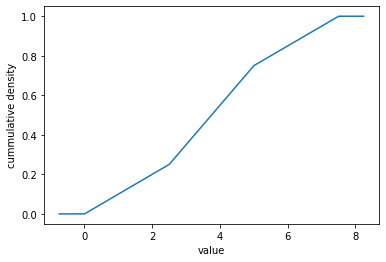
out = u1_or_u2.plot_cdf(show=True)
u1_or_u2.sample(size=10)
array([1.75272189, 3.64947237, 2.05327082, 4.68862709, 3.61022789,
       4.32594884, 6.8813693 , 7.21653759, 7.45465418, 7.07706032,
       6.93707193])
out = u1_or_u2.plot(show=True)
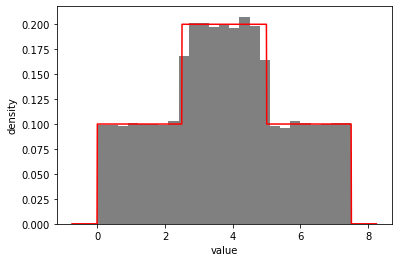
u1_or_u2.to_histogram().pdf(3.5)
0.19872661419164947
u1_or_u2.pdf(3.5)
0.19998800071995682
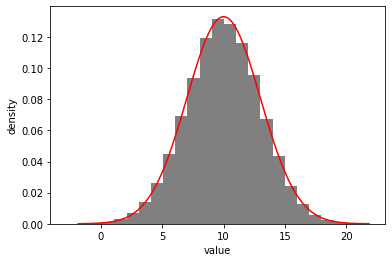
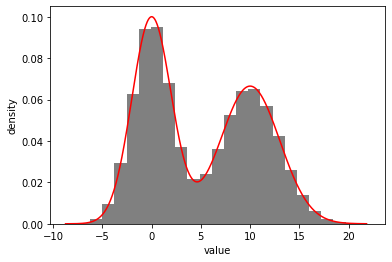
out = (g1 | g2).plot(show=True)
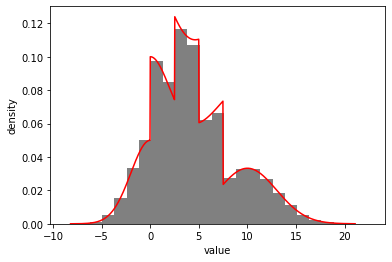
out = ((g1 | g2) | (u1 | u2)).plot(show=True)
AND
u1_and_u2 = u1 & u2
out = u1_and_u2.plot(show=True)
u1_and_u2.pdf(3.5)
0.39996800255979525
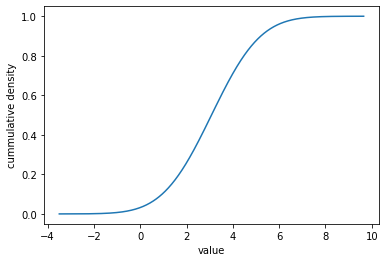
g1_and_g2 = g1 & g2
out = g1_and_g2.plot(show=True)
out = g1_and_g2.plot_cdf(show=True)
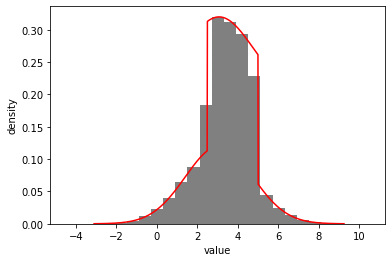
out = ((u1 & u2) | (g1 & g2)).plot(show=True)