import distl
import numpy as np
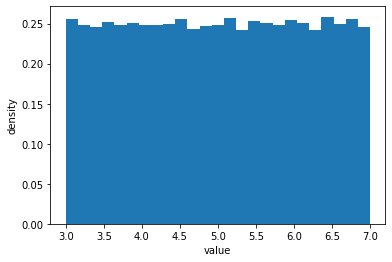
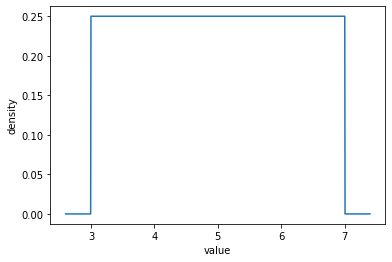
u = distl.uniform(3, 7)
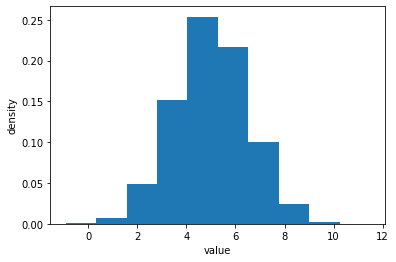
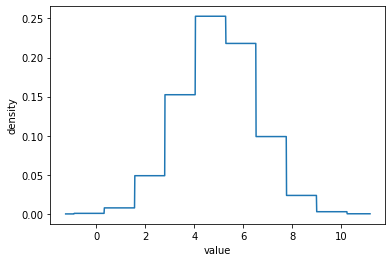
gh = distl.gaussian(5, 1.5).to_histogram()
plot_sample
out = u.plot_sample(show=True)
out = gh.plot_sample(show=True)
for more options, see the plot_sample API docs.
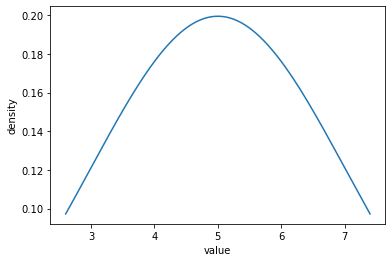
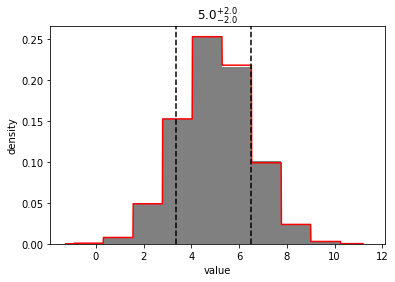
plot_pdf
out = u.plot_pdf(show=True)
out = gh.plot_pdf(show=True)
for more options, see the plot_pdf API docs.
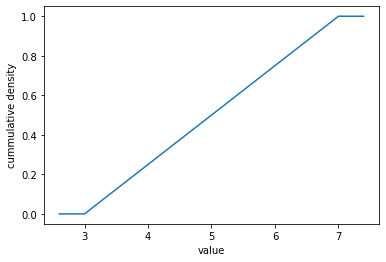
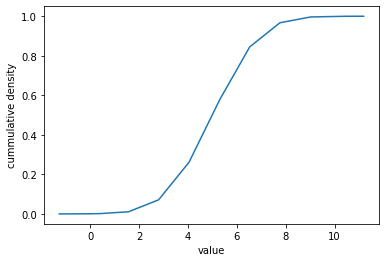
plot_cdf
out = u.plot_cdf(show=True)
out = gh.plot_cdf(show=True)
for more options, see the plot_cdf API docs.
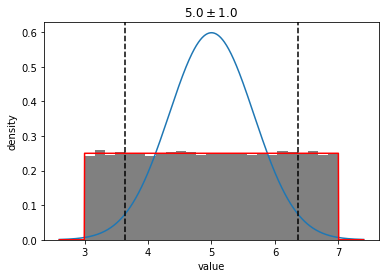
plot_gaussian
out = u.plot_gaussian(show=True)
out = gh.plot_gaussian(show=True)

for more options, see the plot_gaussian API docs.
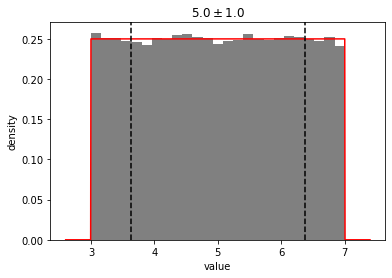
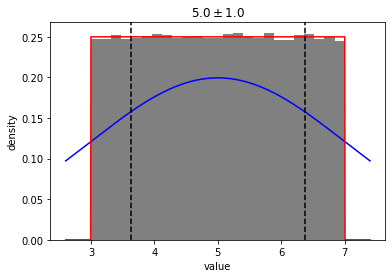
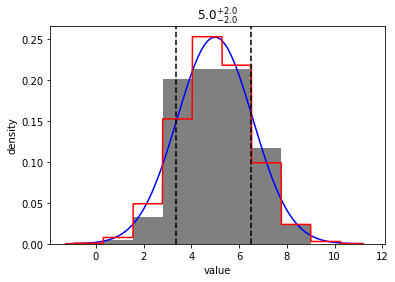
plot
out = u.plot(show=True)
out = u.plot(show=True, plot_gaussian=True)
out = u.plot(show=True, plot_gaussian=True, plot_gaussian_kwargs={'sigma': 3})
out = gh.plot(show=True)
out = gh.plot(200, show=True, plot_gaussian=True)
for more options, see the plot API docs.