import distl
import numpy as np
Multivariate Gaussian
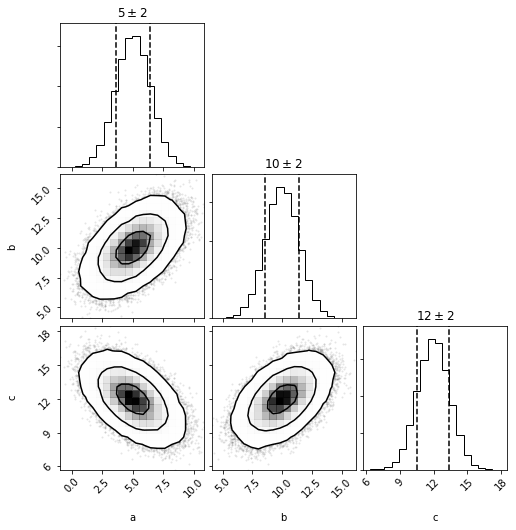
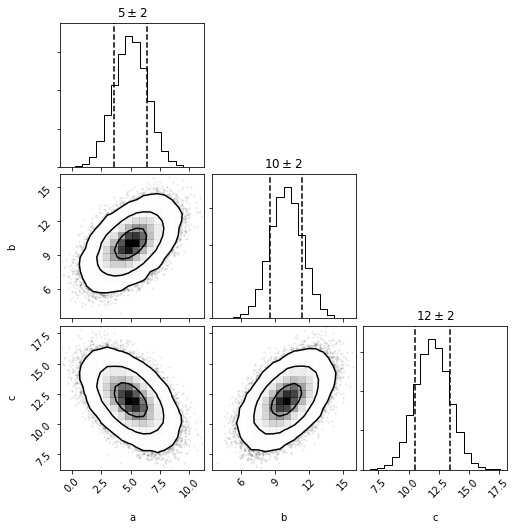
First we'll create a multivariate gaussian distribution by providing the means and covariances of three parameters.
mvg = distl.mvgaussian([5,10, 12],
                       np.array([[ 2,  1, -1],
                                 [ 1,  2,  1],
                                 [-1,  1,  2]]),
                       allow_singular=True,
                       labels=['a', 'b', 'c'])
fig = mvg.plot(show=True)
mvg_a = mvg.slice('a')
mvg_a
<distl.mvgaussianslice dimension=0 mean=[5, 10, 12] cov=[[ 2  1 -1]
 [ 1  2  1]
 [-1  1  2]] allow_singular=True label=a)>
mvg_a.multivariate
<distl.mvgaussian mean=[5, 10, 12] cov=[[ 2  1 -1]
 [ 1  2  1]
 [-1  1  2]] allow_singular=True labels=['a', 'b', 'c']>
mvg_a.dimension
0
mvg_a.label
'a'
The sliced object acts more or less as the univariate version of the multivariate distribution.
mvg_a.loc
5
mvg_a.scale
1.4142135623730951
Sampling draws from the underlying multivariate distribution but only returns the value for the requested dimension. This means that covariances can be maintained (when using DistributionCollection or carefully managing the random seeds manually).
mvg_a.sample()
7.455968009585329
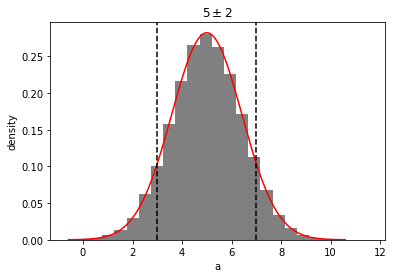
out = mvg_a.plot(show=True)
The exposed univariate methods (pdf, cdf, etc) are based on the univariate version (with the exception of ppf, which is disabled). If you want the probability of drawing a value of 'a', given some values of 'b' and 'c' (for example), then must pass those three values to the underlying multivariate distribution.
NOTE: currently there is no ability to plot_pdf of a with fixed values of b and c.... maybe that would be a better use of "slice" and use "flatten" for this current behavior?
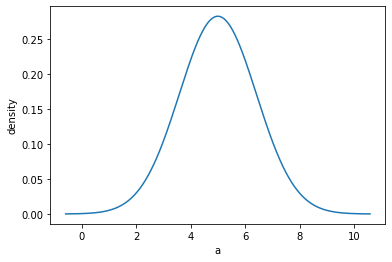
out = mvg_a.plot_pdf(show=True)
out = mvg_a.multivariate.plot(show=True)
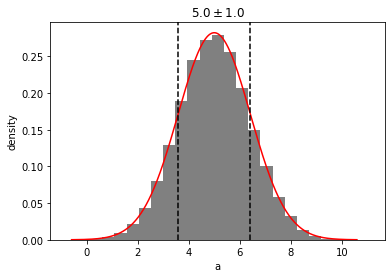
g_a = mvg_a.to_univariate()
# same as mvg.to_univariate(dimension='a')
g_a
<distl.gaussian loc=5.0 scale=1.4142135623730951 label=a>
out = g_a.plot(show=True)
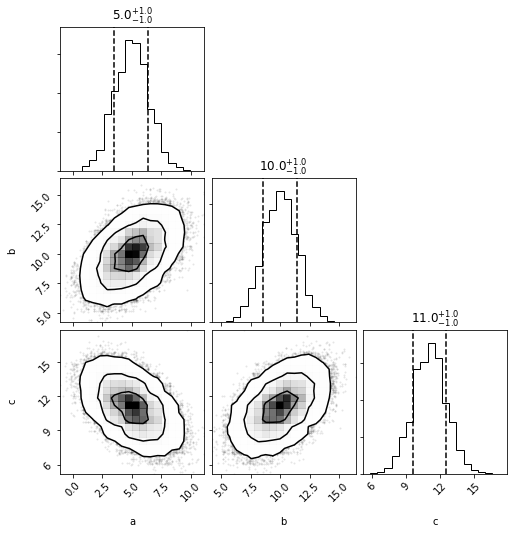
mvh = mvg.to_mvhistogram()
Multivariate Histogram
out = mvh.plot(show=True)
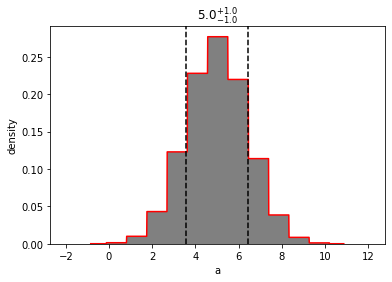
mvh_a = mvh.slice('a')
mvh_a.sample()
array([7.39157786])
mvh_a.sample(size=3)
array([7.20360738, 6.20109814, 4.13342284])
mvh_a.bins
array([-2.00694623, -1.06709382, -0.12724141,  0.812611  ,  1.7524634 ,
        2.69231581,  3.63216822,  4.57202063,  5.51187304,  6.45172545,
        7.39157786,  8.33143027,  9.27128268, 10.21113509, 11.1509875 ,
       12.09083991])
mvh_a.density
array([8.04597982e-06, 1.60919596e-04, 1.83314240e-03, 1.26402343e-02,
       5.42674519e-02, 1.54812698e-01, 2.87132859e-01, 3.48774451e-01,
       2.76793775e-01, 1.43459820e-01, 4.85655342e-02, 1.08486628e-02,
       1.54348713e-03, 1.43486640e-04, 1.20689697e-05])
out = mvh_a.plot(show=True, bins=10)
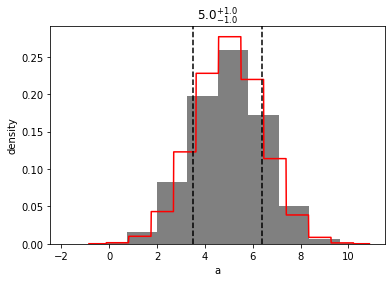
out = mvh_a.to_univariate().plot(show=True)