import distl
import astropy.units as u
Example 1: Gaussian with Custom wrap_at
Let's create a Gaussian distribution centered around 10, and tell distl to wrap the distribution at 12. Whenever we call sample, values that extend beyone 10 will be wrapped onto the range [0-10].
g = distl.gaussian(10, 3, wrap_at=12)
out = g.plot(show=True)
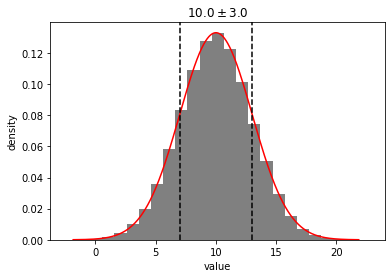
To temporarily disable wrapping, just pass wrap_at=False to sample or plot.
out = g.plot(show=True, wrap_at=False)
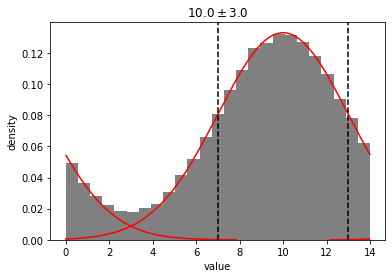
To temporarily use a different value for wrapping, pass that value to wrap in sample or plot
out = g.plot(show=True, wrap_at=14)
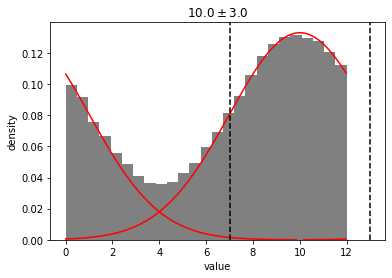
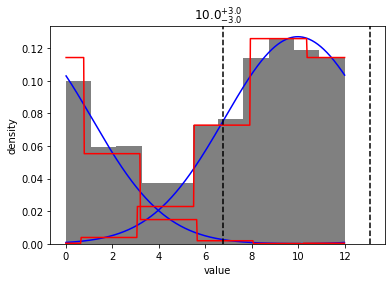
If we convert this Gaussian distribution to a Histogram, the wrapping will be maintained. But note that the underlying distribution bins will be unwrapped, meaning that we can still fit a guassian pre-wrapping.
gh = g.to_histogram()
out = gh.plot(show=True, plot_gaussian=True)
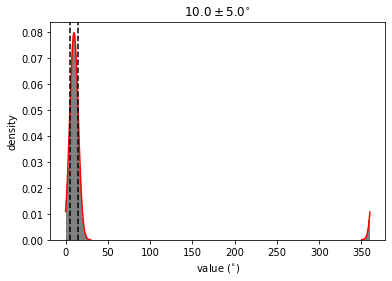
Example 2: Automatic Wrapping for Distributions with Angle Units
i = distl.gaussian(10, 5)*u.deg
out = i.plot(show=True, bins=200)
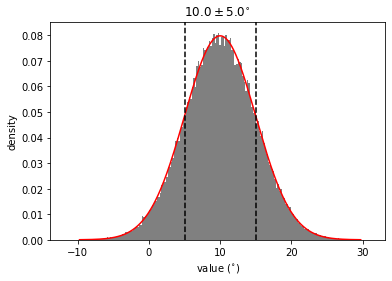
out = i.plot(show=True, wrap_at=False, bins=200)
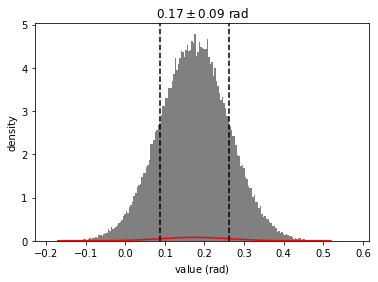
out = i.plot(show=True, bins=200, wrap_at=False, unit=u.rad)
# NOTE: plot_pdf normalization does not always handle unit-conversion correctly
# but this should only affect plotting
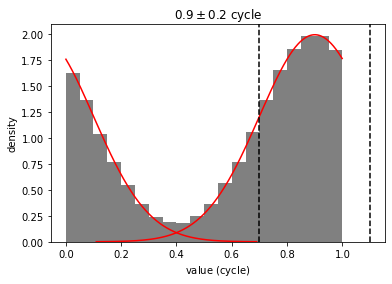
p = distl.gaussian(0.9, 0.2)*u.cycle
out = p.plot(show=True, bins=20)
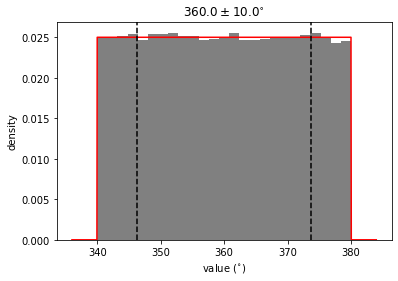
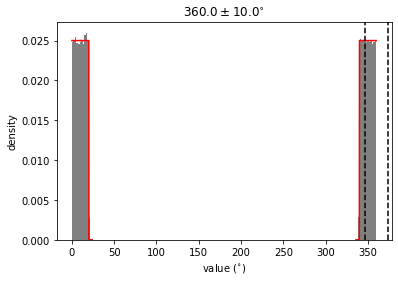
Example 3: Uniform Distribution with low > high
NOTE: this is currently broken, but will hopefully be fixed before the first official release
b = distl.uniform(340, 20, unit=u.deg)
out = b.plot(show=True, bins=200)
Note that low > high is only permitted if wrap_at is provided (or defaulted based on angular units). In this case, the passed value of low is automatically altered to low + wrap_at.
For example:
print(b.get_wrap_at())
360
print(b.low, b.high)
340.0 380.0
out = b.plot(show=True, wrap_at=False)