import distl
import astropy.units as u
Example 1: Gaussian with Custom wrap_at
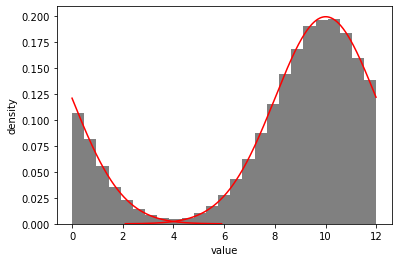
Let's create a Gaussian distribution centered around 10, and tell distl to wrap the distribution at 12. Whenever we call sample, values that extend beyone 10 will be wrapped onto the range [0-10].
g = distl.gaussian(10, 2, wrap_at=12)
out = g.plot(show=True)
To temporarily disable wrapping, just pass wrap_at=False to sample or plot.
out = g.plot(show=True, wrap_at=False)

To temporarily use a different value for wrapping, pass that value to wrap in sample or plot
out = g.plot(show=True, wrap_at=14)

If we convert this Gaussian distribution to a Histogram, the wrapping will be maintained. But note that the underlying distribution bins will be unwrapped, meaning that we can still fit a guassian pre-wrapping.
gh = g.to_histogram()
out = gh.plot(show=True, plot_gaussian=True)

Example 2: Automatic Wrapping for Distributions with Angle Units
i = distl.gaussian(10, 5)*u.deg
out = i.plot(show=True, bins=200)

out = i.plot(show=True, wrap_at=False, bins=200)

out = i.plot(show=True, bins=200, wrap_at=False, unit=u.rad)
# TODO: need to fix plot_pdf renormalization for changing units

p = distl.gaussian(0.9, 0.2)*u.cycle
out = p.plot(show=True, bins=20)

Example 3: Uniform Distribution with low > high
NOTE: this is currently broken, but will hopefully be fixed before the first official release
b = distl.uniform(340, 20)*u.deg
out = b.plot(show=True, bins=200)
# TODO: this seems to be broken by the rewrite
/home/kyle/.local/lib/python3.7/site-packages/matplotlib/axes/_axes.py:6735: RuntimeWarning: All-NaN slice encountered
  xmin = min(xmin, np.nanmin(xi))
/home/kyle/.local/lib/python3.7/site-packages/matplotlib/axes/_axes.py:6736: RuntimeWarning: All-NaN slice encountered
  xmax = max(xmax, np.nanmax(xi))


---------------------------------------------------------------------------

ValueError                                Traceback (most recent call last)

<ipython-input-10-126eaa1bb839> in <module>
      1 b = distl.uniform(340, 20)*u.deg
----> 2 out = b.plot(show=True, bins=200)
      3 # TODO: this seems to be broken by the rewrite


~/.local/lib/python3.7/site-packages/distl-0.1.0.dev1-py3.7.egg/distl/distl.py in plot(self, size, unit, wrap_at, seed, samples, plot_sample, plot_sample_kwargs, plot_pdf, plot_pdf_kwargs, plot_cdf, plot_cdf_kwargs, plot_gaussian, plot_gaussian_kwargs, label, xlabel, show, **kwargs)
   1141             for k,v in kwargs.items():
   1142                 plot_sample_kwargs.setdefault(k,v)
-> 1143             ret_sample = self.plot_sample(size=int(size), samples=samples, unit=unit, wrap_at=wrap_at, seed=seed, show=False, **plot_sample_kwargs)
   1144         else:
   1145             ret_sample = None


~/.local/lib/python3.7/site-packages/distl-0.1.0.dev1-py3.7.egg/distl/distl.py in plot_sample(self, size, unit, wrap_at, seed, samples, label, xlabel, show, **kwargs)
   1279
   1280         try:
-> 1281             ret = _plt.hist(samples, density=True, **kwargs)
   1282         except AttributeError:
   1283             # TODO: determine which version of matplotlib


~/.local/lib/python3.7/site-packages/matplotlib/pyplot.py in hist(x, bins, range, density, weights, cumulative, bottom, histtype, align, orientation, rwidth, log, color, label, stacked, normed, data, **kwargs)
   2640         align=align, orientation=orientation, rwidth=rwidth, log=log,
   2641         color=color, label=label, stacked=stacked, normed=normed,
-> 2642         **({"data": data} if data is not None else {}), **kwargs)
   2643
   2644


~/.local/lib/python3.7/site-packages/matplotlib/__init__.py in inner(ax, data, *args, **kwargs)
   1599     def inner(ax, *args, data=None, **kwargs):
   1600         if data is None:
-> 1601             return func(ax, *map(sanitize_sequence, args), **kwargs)
   1602
   1603         bound = new_sig.bind(ax, *args, **kwargs)


~/.local/lib/python3.7/site-packages/matplotlib/axes/_axes.py in hist(self, x, bins, range, density, weights, cumulative, bottom, histtype, align, orientation, rwidth, log, color, label, stacked, normed, **kwargs)
   6765             # this will automatically overwrite bins,
   6766             # so that each histogram uses the same bins
-> 6767             m, bins = np.histogram(x[i], bins, weights=w[i], **hist_kwargs)
   6768             m = m.astype(float)  # causes problems later if it's an int
   6769             if mlast is None:


<__array_function__ internals> in histogram(*args, **kwargs)


~/.local/lib/python3.7/site-packages/numpy/lib/histograms.py in histogram(a, bins, range, normed, weights, density)
    793     a, weights = _ravel_and_check_weights(a, weights)
    794
--> 795     bin_edges, uniform_bins = _get_bin_edges(a, bins, range, weights)
    796
    797     # Histogram is an integer or a float array depending on the weights.


~/.local/lib/python3.7/site-packages/numpy/lib/histograms.py in _get_bin_edges(a, bins, range, weights)
    427             raise ValueError('`bins` must be positive, when an integer')
    428
--> 429         first_edge, last_edge = _get_outer_edges(a, range)
    430
    431     elif np.ndim(bins) == 1:


~/.local/lib/python3.7/site-packages/numpy/lib/histograms.py in _get_outer_edges(a, range)
    325         if not (np.isfinite(first_edge) and np.isfinite(last_edge)):
    326             raise ValueError(
--> 327                 "autodetected range of [{}, {}] is not finite".format(first_edge, last_edge))
    328
    329     # expand empty range to avoid divide by zero


ValueError: autodetected range of [nan, nan] is not finite

Note that passing wrap_at to sample or plot will only affect the wrapping after sampling. To change the "unwrapping" of the low and high bounds of the boxcar, you must change the attributes themselves. For example:
print(b.low, b.high)
print(b.get_wrap_at())
out = b.plot(show=True, wrap_at=False)